
Financial Highlight
(\Millions)
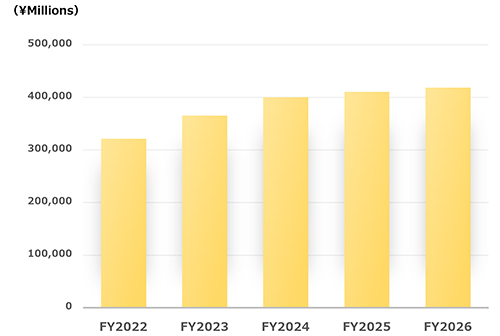
Net sales
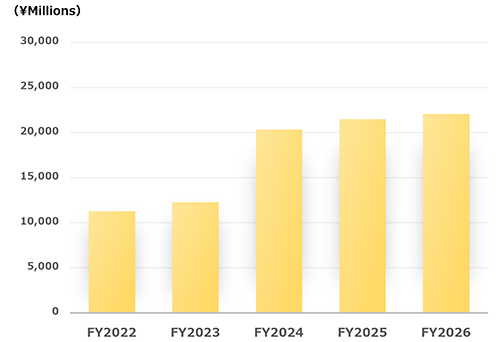
Operating income
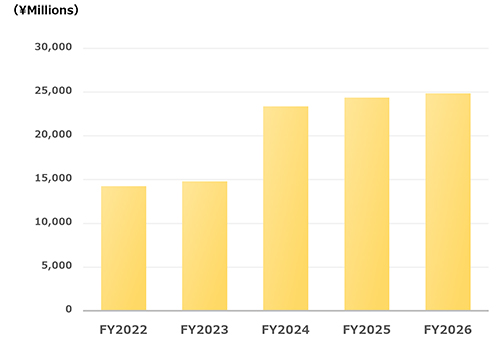
Ordinary income
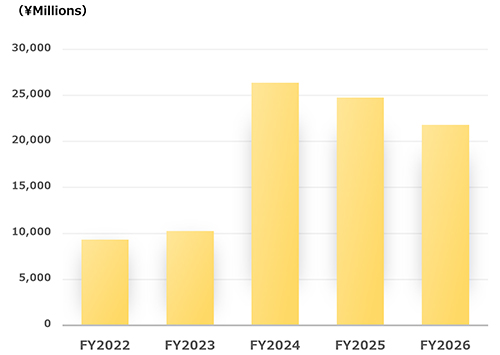
Profit attributable to owners of parent
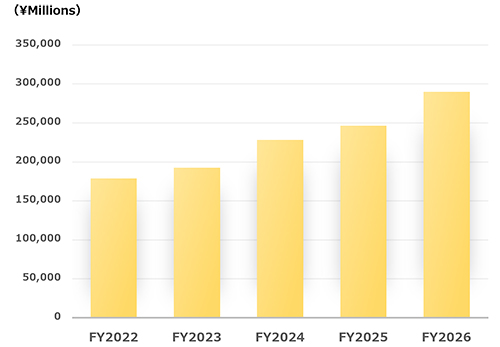
Net assets
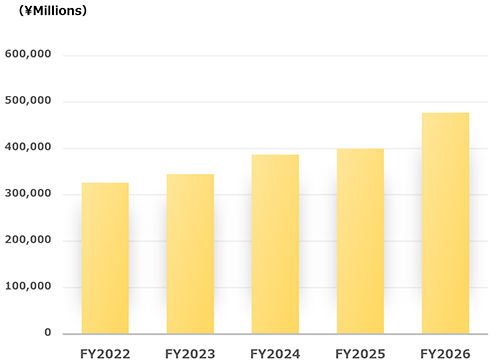
Total assets
Financial Highlight (Consolidated)
| Fiscal year ended | 2022.3 | 2023.3 | 2024.3 | 2025.3 | 2026.3 | |
|---|---|---|---|---|---|---|
| Net sales | ¥ Millions | 321,317 | 365,525 | 400,514 | 410,878 | 418,425 |
| Operating income | ¥ Millions | 11,282 | 12,288 | 20,340 | 21,486 | 22,082 |
| Ordinary income | ¥ Millions | 14,270 | 14,816 | 23,280 | 24,393 | 24,874 |
| Profit attributable to owners of parent | ¥ Millions | 9,327 | 10,260 | 26,367 | 24,757 | 21,803 |
| Comprehensive income | ¥ Millions | 12,514 | 17,481 | 39,614 | 23,779 | 36,507 |
| Net assets | ¥ Millions | 178,697 | 192,613 | 228,285 | 246,484 | 289,877 |
| Total assets | ¥ Millions | 325,869 | 344,606 | 386,692 | 399,226 | 476,826 |
| Net assets per share | ¥ | 2,268.30 | 2,421.48 | 2,874.28 | 3,102.27 | 3,415.52 |
| Net income per share | ¥ | 121.59 | 132.16 | 338.20 | 317.27 | 262.51 |
| Equity ratio | % | 53.4 | 54.8 | 58.0 | 60.7 | 59.2 |
| ROE | % | 5.51 | 5.66 | 12.78 | 10.62 | 8.31 |
| PER | times | 13.68 | 12.16 | 6.23 | 7.05 | 9.05 |
| Cash flows from operating activities | ¥ Millions | 11,975 | 15,055 | 24,022 | 18,768 | 25,272 |
| Cash flows from investing activites | ¥ Millions | (10,103) | (5,026) | (9,489) | (7,807) | (27,088) |
| Cash flows from financing activities | ¥ Millions | (4,278) | (8,402) | (7,241) | (10,533) | 24,467 |
| Cash and cash equivalents at end of the year | ¥ Millions | 31,215 | 33,157 | 40,728 | 41,471 | 64,222 |
| Number of employees | 3,775 | 3,848 | 3,829 | 3,863 | 3,935 | |
- * The Company has applied the Accounting Standard for Revenue Recognition (ASBJ Statement No. 29, March 31, 2020), etc. since the beginning of fiscal year ended March 31, 2022, and the accounting standard, etc. are applied retroactively to major management indicators, etc. for the fiscal year ended March 31, 2021.
- * The Company has introduced a Board Benefit Trust (BBT) since the fiscal 2024. Our shares held by the Custody Bank of Japan, Ltd. (Trust E Account) as the trust property of the said Board Benefit Trust (BBT) are included intreasury shares to be deducted from the calculation of, the average number of shares during the period in the calculation of NetAssets per Share (Yen), Profit per Share and Fully Diluted Profit per Share (Yen).
Financial Highlight (Non - Consolidated)
| Fiscal year ended | 2022.3 | 2023.3 | 2024.3 | 2025.3 | 2026.3 | |
|---|---|---|---|---|---|---|
| Net sales | ¥ Millions | 193,558 | 225,014 | 248,176 | 253,240 | 253,608 |
| Operating income | ¥ Millions | 9,489 | 8,942 | 12,368 | 13,145 | 13,429 |
| Ordinary income | ¥ Millions | 12,496 | 11,613 | 15,677 | 18,719 | 16,701 |
| Net income | ¥ Millions | 10,222 | 3,414 | 22,159 | 21,959 | 16,799 |
| Net assets | ¥ Millions | 150,552 | 158,797 | 186,540 | 198,324 | 230,197 |
| Total assets | ¥ Millions | 257,369 | 271,119 | 302,123 | 313,247 | 380,256 |
| Net assets per share | ¥ | 1,953.89 | 2,030.01 | 2,384.85 | 2,534.42 | 2,778.47 |
| Dividend per share | ¥ | 38.00 | 40.00 | 66.00 | 66.00 | 68.00 |
| Interim dividend per share | ¥ | 18.00 | 19.00 | 28.00 | 33.00 | 33.00 |
| Net income per share | ¥ | 132.93 | 43.88 | 283.65 | 280.86 | 201.89 |
| Equity ratio | % | 58.4 | 58.5 | 61.7 | 63.3 | 60.5 |
| ROE | % | 7.03 | 2.21 | 12.85 | 11.42 | 7.84 |
| PER | times | 12.51 | 36.62 | 7.43 | 7.96 | 11.77 |
| Number of employees | 1,137 | 1,156 | 1,173 | 1,210 | 1,244 | |
- * The Company has applied the Accounting Standard for Revenue Recognition (ASBJ Statement No. 29, March 31, 2020), etc. since the beginning of fiscal year ended March 31, 2022, and the accounting standard, etc. are applied retroactively to major management indicators, etc. for the fiscal year ended March 31, 2021.
- * The Company has introduced a Board Benefit Trust (BBT) since the fiscal 2024. Our shares held by the Custody Bank of Japan, Ltd. (Trust E Account) as the trust property of the said Board Benefit Trust (BBT) are included intreasury shares to be deducted from the calculation of, the average number of shares during the period in the calculation of NetAssets per Share (Yen), Profit per Share and Fully Diluted Profit per Share (Yen).
- * Dividends per share for fiscal 2021 includes the company name change commemorative dividend of 2 yen.